A 2-year futures contract on a stock paying a continuous dividend yield of 3% pa was bought when the underlying stock price was $10 and the risk free rate was 10% per annum with continuous compounding. Assume that investors are risk-neutral, so the stock's total required return is the risk free rate.
Find the forward price (F2) and value of the contract (V0) initially. Also find the value of the contract in 6 months (V0.5) if the stock price rose to $12.
A stock is expected to pay a dividend of $5 per share in 1 month and $5 again in 7 months.
The stock price is $100, and the risk-free rate of interest is 10% per annum with continuous compounding. The yield curve is flat. Assume that investors are risk-neutral.
An investor has just taken a short position in a one year forward contract on the stock.
Find the forward price (F1) and value of the contract (V0) initially. Also find the value of the short futures contract in 6 months (V0.5, SF) if the stock price fell to $90.
A stock, a call, a put and a bond are available to trade. The call and put options' underlying asset is the stock they and have the same strike prices, KT.
Being long the call and short the stock is equivalent to being:
A stock, a call, a put and a bond are available to trade. The call and put options' underlying asset is the stock they and have the same strike prices, KT.
You are currently long the stock. You want to hedge your long stock position without actually trading the stock. How would you do this?
Question 797 option, Black-Scholes-Merton option pricing, option delta, no explanation
Which of the following quantities from the Black-Scholes-Merton option pricing formula gives the risk-neutral probability that a European put option will be exercised?
Question 719 mean and median returns, return distribution, arithmetic and geometric averages, continuously compounding rate
A stock has an arithmetic average continuously compounded return (AALGDR) of 10% pa, a standard deviation of continuously compounded returns (SDLGDR) of 80% pa and current stock price of $1. Assume that stock prices are log-normally distributed. The graph below summarises this information and provides some helpful formulas.
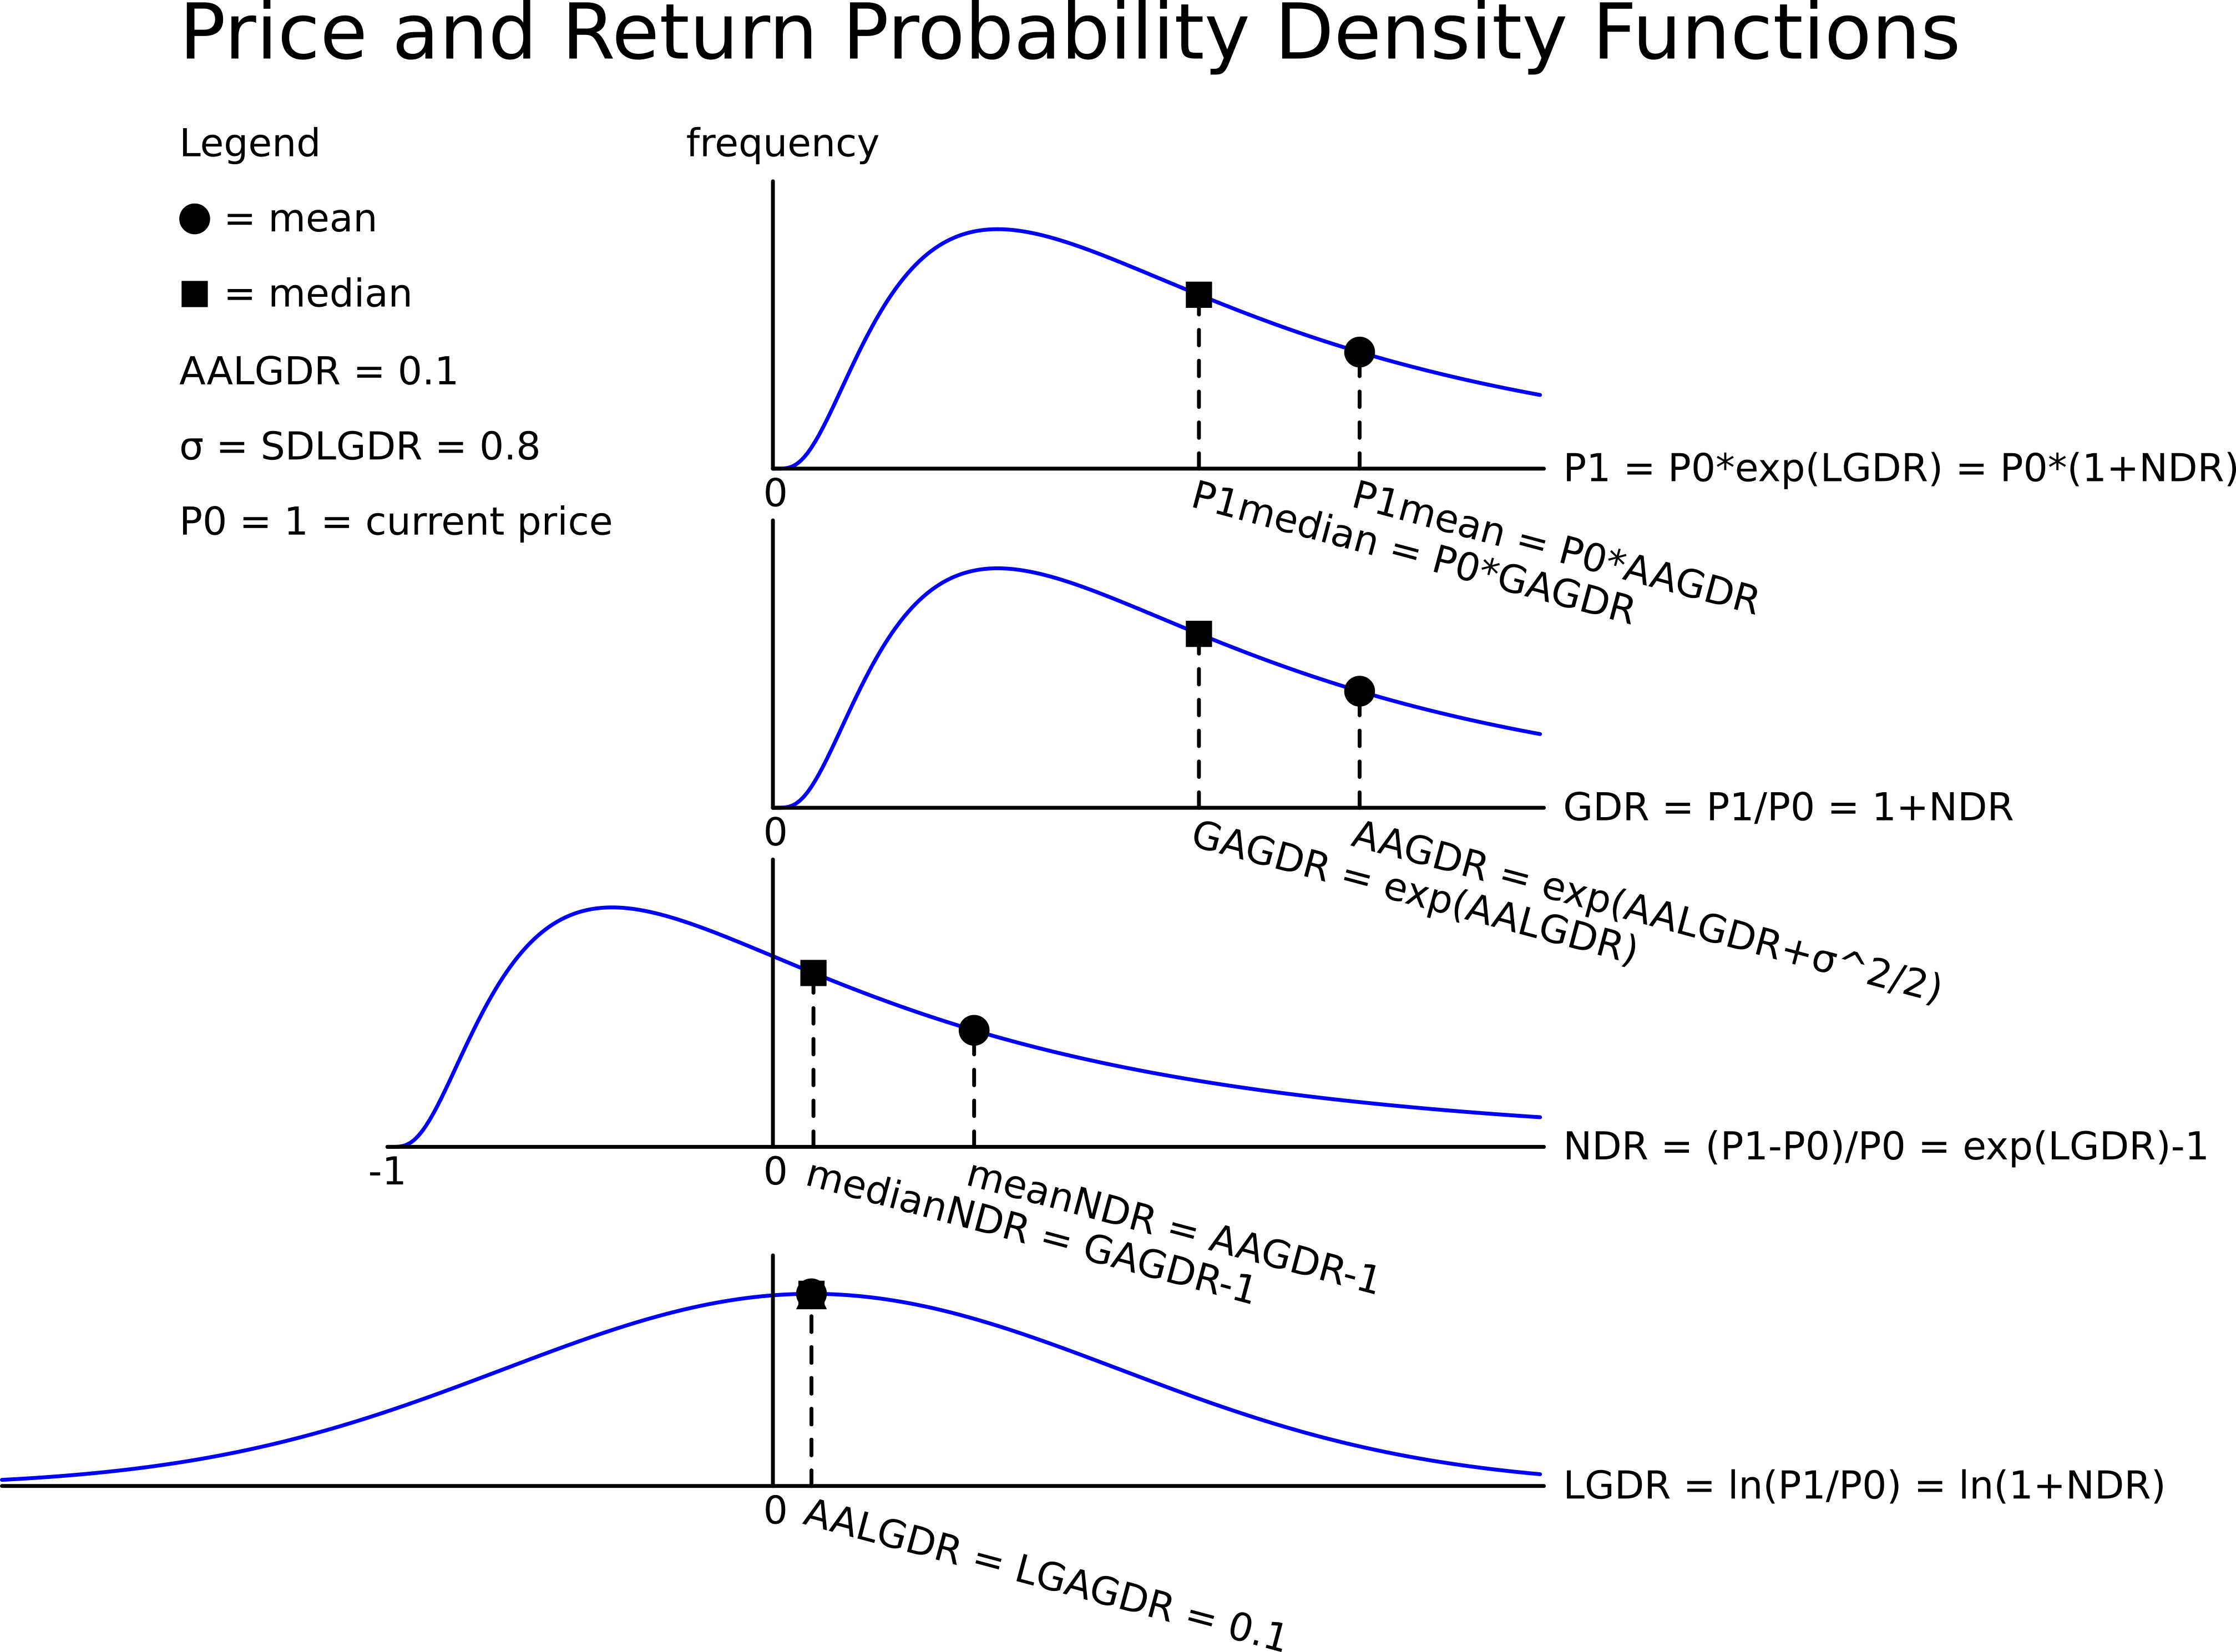
In one year, what do you expect the median and mean prices to be? The answer options are given in the same order.
Question 723 mean and median returns, return distribution, arithmetic and geometric averages, continuously compounding rate
Here is a table of stock prices and returns. Which of the statements below the table is NOT correct?
| Price and Return Population Statistics | ||||
| Time | Prices | LGDR | GDR | NDR |
| 0 | 100 | |||
| 1 | 99 | -0.010050 | 0.990000 | -0.010000 |
| 2 | 180.40 | 0.600057 | 1.822222 | 0.822222 |
| 3 | 112.73 | 0.470181 | 0.624889 | 0.375111 |
| Arithmetic average | 0.0399 | 1.1457 | 0.1457 | |
| Arithmetic standard deviation | 0.4384 | 0.5011 | 0.5011 | |
You deposit money into a bank. Which of the following statements is NOT correct? You: